Air pollutants harm people and the environment. Some cause direct health problems, like heart and lung diseases, while others, like greenhouse gases, cause indirect harm by driving climate change. Air pollutant emissions sources range from vehicles and household furnaces, to marine vessels and large-scale industrial operations. Metro Vancouver prepares several inventories to keep track of these emissions.
Annual greenhouse gas emissions inventory for Metro Vancouver
This inventory is completed annually and focuses on the Metro Vancouver region. It helps with tracking progress towards greenhouse gas (GHG) reduction targets. The inventory includes annual GHG emissions for the highest-emitting sectors, such as transportation, buildings, and industry, and other emissions sources. This inventory also reports GHG emissions for each municipality, electoral area, and treaty First Nation within Metro Vancouver.
Metro Vancouver region-wide greenhouse gas emissions by sector
Greenhouse gas emissions

Figures represent Metro Vancouver emissions data from 2022
Per capita emissions
|
|---|
| 2010 | 6.7 tonnes |
| 2022 | 6.0 tonnes |
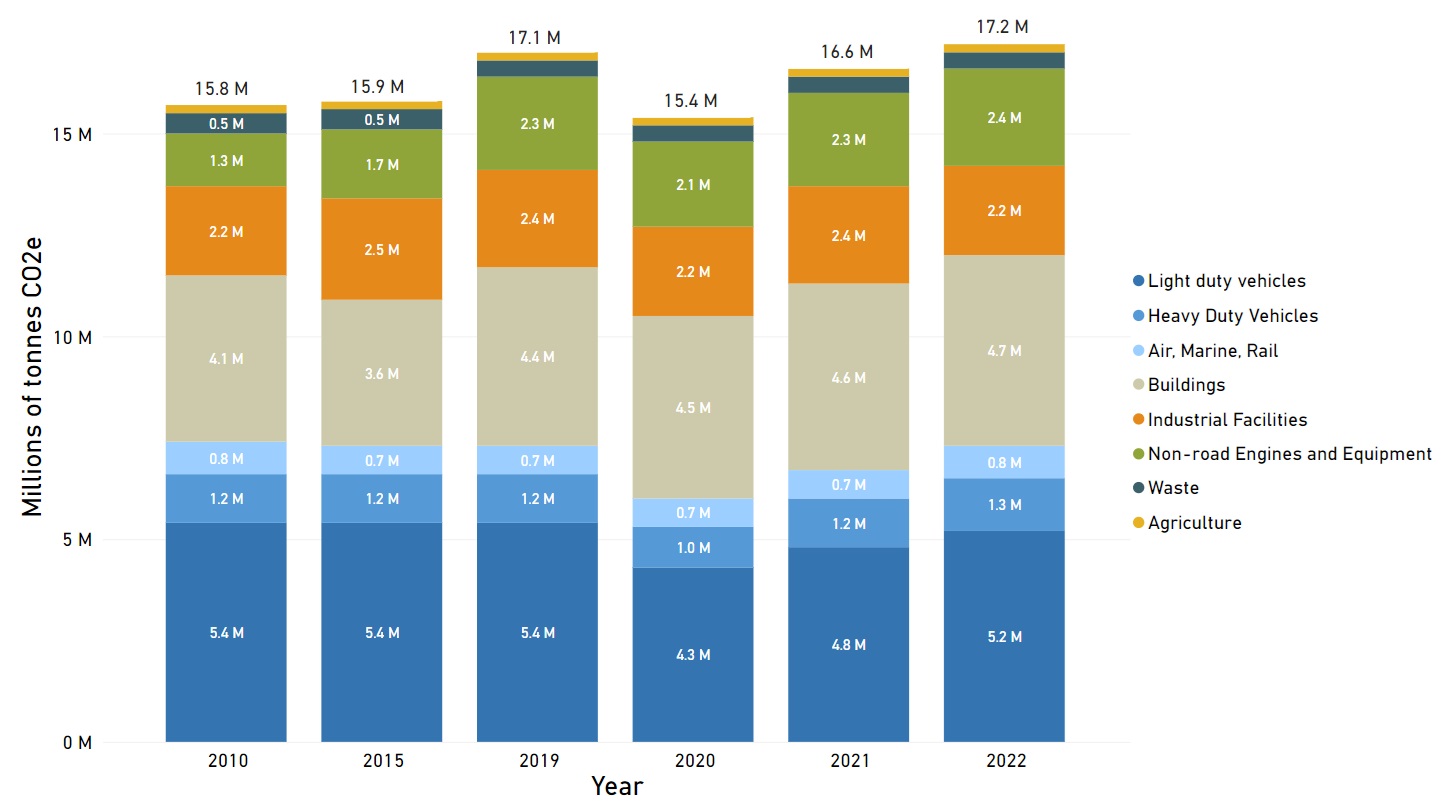
2022 Metro Vancouver GHG emissions by sector (total 17.2 million tonnes)
Figures represent Metro Vancouver emissions data from 2022.
For additional GHG emissions data for Metro Vancouver member jurisdictions, contact AQInfo@metrovancouver.org.
| Metro Vancouver GHG Emissions (millions of tonnes CO2e)
|
|---|
| Light Duty Vehicles | 5.4
| 5.4 | 5.4 | 4.3 | 4.8 | 5.2 |
| Heavy Duty Vehicles | 1.2 | 1.2 | 1.2 | 1 | 1.2 | 1.3 |
| Air, Marine, Rail | 0.8 | 0.7 | 0.7 | 0.7 | 0.7 | 0.8 |
| Buildings | 4.1 | 3.6 | 4.4
| 4.5 | 4.6 | 4.7 |
| Industrial Facilities | 2.2 | 2.5 | 2.4 | 2.2 | 2.4 | 2.2 |
| Non-road Engines and Equipment | 1.3 | 1.7 | 2.3 | 2.1 | 2.3 | 2.4 |
| Waste | 0.5 | 0.5 | 0.4 | 0.4 | 0.4 | 0.4 |
| Agriculture | 0.2 | 0.2 | 0.2 | 0.2 | 0.2 | 0.2 |
Lower Fraser Valley emissions inventory
Metro Vancouver prepares a broader emissions inventory for the Lower Fraser Valley, which includes both the Metro Vancouver and Fraser Valley regions, every five years. The inventory includes estimates of health-harming air contaminant and greenhouse gas emissions in these two regions for a range of sources, including transportation, industry, buildings, agriculture, and waste. The inventory also includes emissions trends over the past 20 years. An emissions inventory for the year 2020 will be posted in summer 2026. For emissions inventory data for 2020, contact
AQInfo@metrovancouver.org.
Health-harming air contaminant emissions (total 80,900 tonnes)
Figures represent Metro Vancouver emissions data from 2020
Health-harming air contaminant emissions

Figures represent Metro Vancouver emissions data from 2015
Consumption-based emissions inventory
The consumption-based emissions inventory (CBEI) complements the Annual Greenhouse Gas Emissions Inventory for Metro Vancouver. The CBEI extends the annual GHG inventory by accounting for emissions that occur outside the region’s geographical boundary from goods and services that are consumed within the region, such as GHG emissions associated with production, transport, use, and disposal of goods.